E-411 PRMA
Lecture 14 - Equating and Intelligence
Equating Process
- The first form that is used to derive scale scores is the base form
- After the raw-to-scale conversion has occurred this form is on scale
- We then equate a new form to a form that is already on scale
- The form already on scale is our reference form and the form that is not yet equated is our new form
- Once our new form is on scale, we can calculate raw scores for the new test takers for the reference form and use the reference form to derive scaled scores
- An issue - Can derive reference scores that weren't possible because of discreteness
Our first def'n of Equating
“A score on the new form and a score on the reference form are equivalent in a group of test takers if they represent the same relative position in the group.”
Mean Equating
The simplest form of equating involves adjusting the scores by the difference in means between the reference and new forms
Substraction of values if the new form is easier
Addition of values if the new form is harder
Example
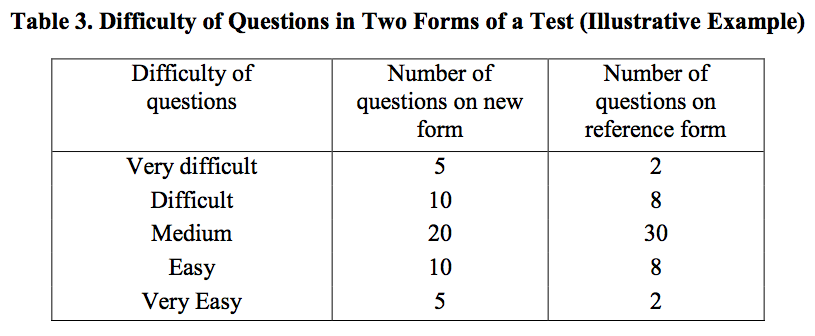
Suppose the target population's mean on the reference form was 80 and their mean on the new form was 85.
- Which form was harder?
- What should should someone with a 90 on the new form get on the reference form if we were using mean equating?
Problem with mean equating (Livingston, 2014)
Linear equating
We need to adjust based on how high or low a test taker's score is from the mean
What might we consider doing?
Equating better def'n
“ A score on the new form and a score on the reference form are equivalent in a group of test takers if they are the same number of standard deviations above or below the mean of the group. ”
Linear equating a harder new form (Livingston, 2014)
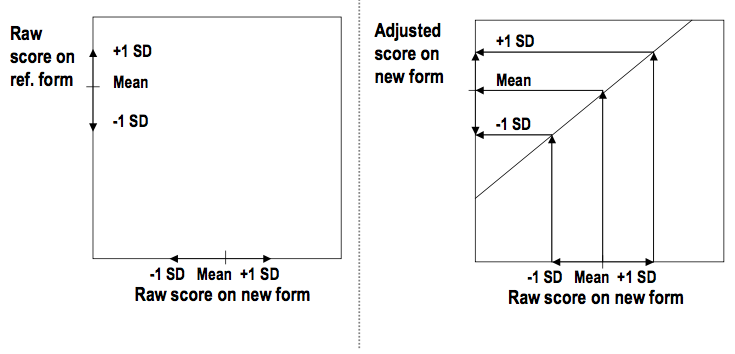
Linear equating conceptually
- Make the adjusted new form mean equal to the reference score mean
- Same with standard deviations above and below the mean
- Do this for every possible value
- This results in a linear relationship between the new form raw and the new form adjusted scores
Doing the maths!
Let NF stand for a score on the new form and RF a score on the reference form
$$ \frac{RF - \bar{RF}}{sd(RF)} = \frac{NF - \bar{NF}}{sd(NF)} $$What do these formulas look like?
Our new adjusted score
$$ RF = \frac{sd(RF)}{sd(NF)}NF + \bar{RF} - \frac{sd(RF)}{sd(NF)}\bar{NF} = \text{adjusted } NF $$Note, the adjusted NF score is very unlikely to ever be a whole number
Example
| Form | Mean | Standard Deviation |
| Reference | 82 | 15 |
| New | 79 | 14 |
If someone scored an 80 on the new form, what should there reference form score be?
# Do the math in R and save it as RF
RF <- (15 / 14) * 80 + 82 - (15 / 14) * 79

# Print RF
RF
[1] 83.07143
Does 83.07413 seem sensible?
Problems with linear equating
A very high or very low score can equate to a score outside of the range on the reference form
Depends heavily on the group of test takers (e.g. are they strong test takers? weak test takers?)
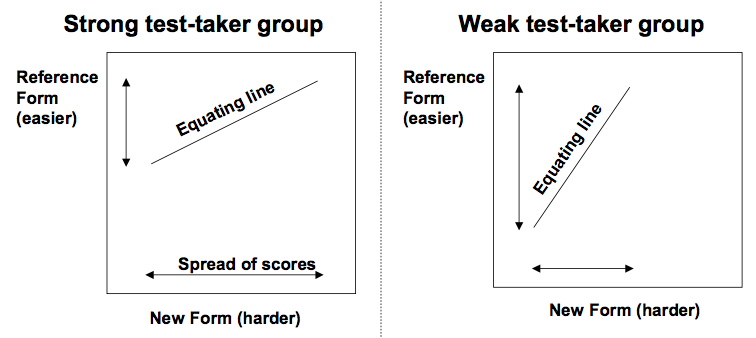
We need an equating that can be shallow for the strong test takers and steep for the weaker ones
Equipercentile equating
“To equate scores on the new form to scores on the reference form in a group of test takers, transform each score on the new form to the score on the reference form that has the same percentile rank in that group.”
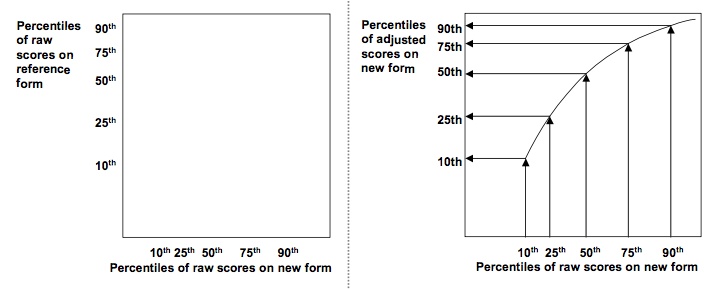
Equipercentile equating with a harder new form
Equipercentile equating
15th percentile of the adjusted test form corresponds (as much as possible) to 15th percentile on the reference form and so on
Adjusted scores will all fall within the range of possible scores on the reference form
The steepness of the slope of the curve can vary
Will result in the adjusted test scores having a similar distribution to the reference form
Will be identical to linear equating when the distribution of scores on the new form has the same shape as the distribution of the scores on the reference form
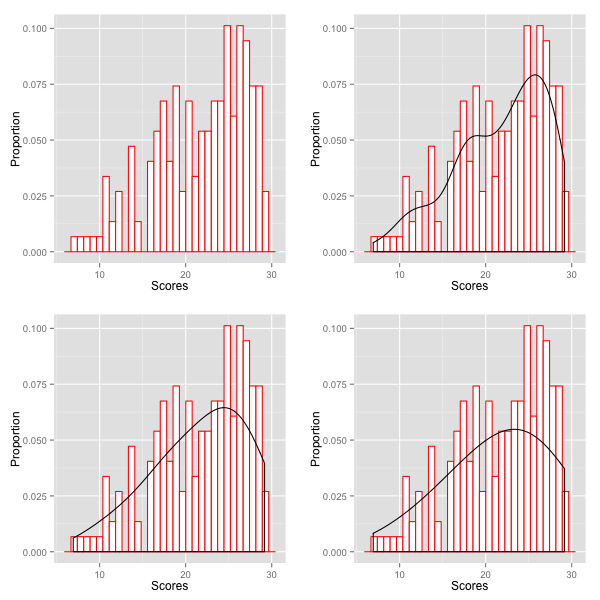
Smoothing
Limitations of equipercentile
Equating relationship is bound by the highest and lowest observed score
On a difficult test, the highest possible raw score might not be observed
Future administration could result in a higher score being observed
Smoothing may help with this
Again, the discreteness problem (Livingston, 2014)
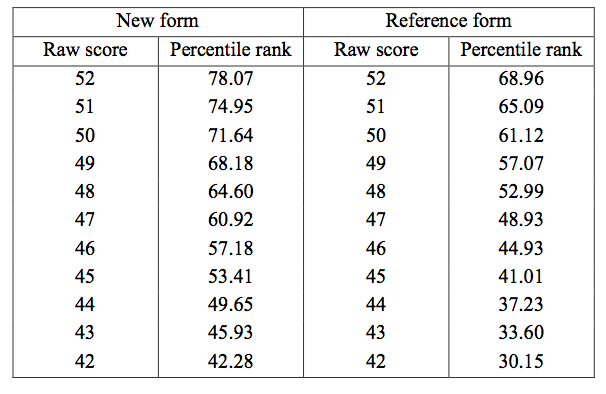
Where should the Raw Score of 49 on the New form go on the Reference form?
Can use interpolation to calculate unobserved raw score
Concluding remarks on equating
- Lots of other equating methods exist beyond these three
- Lots of other equating design exist beyond these introduced (briefly)
- Non-equivalent group designs are tricky
- The equate package in R does all of this (and more)
Intelligence
Intelligence
What is intelligence?
What makes someone intelligent?
Write one item that you measures intelligence
Intelligence is ...
There is no consensus on what intelligence is
There is no single instrument to measure intelligence
To Sternberg's public, intelligence means
"Reasons logically and well"
"Reads widely"
"Displays common sense"
"Keeps an open mind"
"Reads with high comprehension"
Intelligence could involve (Sternberg's findings)
Problem-solving ability
Verbal ability
Social competence
+ academic behaviors (Academic intelligence)
+ interest learning & culture (Everyday intelligence)
Interactionist views of intelligence
Galton - heritable; possessing great sensory (hearing, visual) abilities; measured sensorimotor and perception task
Binet - involves reasoning, judgment, memory, and abstraction and these cannot be assessed seperately
Wechsler - aggregate capacity made of measurable, qualitatively different abilities that interact in a complex, non-additive ways; affected by nonintellective factors (e.g. personality traits); verbal and performance abilities (historical?)
Piaget - evolving biological adaption to the world; assimilation and accomodation
Factor analysis and intelligence
Structure of intelligence exmamined thoroughly using factor analysis to explore relationships between abilities measured on tests
Spearman (1927), two-factor theory of intelligence
Existence of a general ability factor, g and specific factors, s, and unexplained factor variability (e)

Intemediate group factors
