E-411 PRMA
Lecture 13 - Equating
Motivation
Consider the salary of a teacher at a school now and in 1950
Is it fair to compare their salaries?
There salaries will most certainly not be the same
The krona has changed a lot, right?
How can we most fairly compare these salaries?
One possibility would be to compare the salaries against a set up comparable goods (e.g. price of milk, liter of gas, price of a stamp, etc)
How should we compare test scores on different forms of a test?
Equating in testing
- We often have multiple forms of a test
- Parallel or alternate form
- How might we compare these forms?
- Sum up number correct
- Calculate percent correct
- Raw Scores
- Problem: These tests are composed of different questions with differences in item difficulties
- Why is this a problem?
Scaled Scores
Tests need to be comparable across forms
We need to scale our scores to adjust for different difficulty
For each possible raw score, we will come up with a scaled score based on the difficulty of the questions
Review: What measurement framework do you think we are using?
| Scaled Scores | |||
| Raw Score | Form A | Form B | Form C |
| 50 | 130 | 130 | 130 |
| 49 | 130 | 130 | 128 |
| 48 | 129 | 130 | 126 |
| 47 | 127 | 130 | 124 |
| 46 | 126 | 130 | 122 |
| 45 | 124 | 129 | 120 |
| 44 | 121 | 128 | 118 |
| 43 | 119 | 127 | 115 |
| 42 | 118 | 126 | 114 |
| 41 | 117 | 125 | 113 |
| 40 | 116 | 124 | 110 |
Equating Process
- The first form that is used to derive scale scores is the base form
- After the raw-to-scale conversion has occurred this form is on scale
- We then equate a new form to a form that is already on scale
- The form already on scale is our reference form and the form that is not yet equated is our new form
- Once our new form is on scale, we can calculate raw scores for the new test takers for the reference form and use the reference form to derive scaled scores
- An issue - Can derive reference scores that weren't possible because of discreteness
| New Form Raw-to-Raw | Reference Form Raw-to-Scale | ||
| New | Reference | Reference | Scaled |
| ... | ... | ... | ... |
| 39 | 43.25 | 44 | 109.765 |
| 38 | 42.80 | 43 | 107.643 |
| 37 | 41.75 | 42 | 106.902 |
| 36 | 41 | 41 | 103.853 |
What should someone with a 38 on the new form get for a scaled score?
Test takers with a 38 on the new form
38's reference test score was 42.80
This is 80% of the way between 42 and 43
# 80% of the way between 42 and 43
(107.643 - 106.902) * .80
[1] 0.5928

# Add this to the score for 42
106.902 + 0.5928
[1] 107.4948
They should get a 107.4948
Scale Decisions in equating
- Choosing the range of scale scores
- Don't want scale to look like total or percent correct
- How fine should our scale be?
- Usually, want each raw score to correspond to a unique scaled score
- Need to be careful to not exaggerate precision
- Often truncate the scaled scores at the end
- Allows test takers on an easier form than the reference form to get the highest possible scaled score
- Truncate at lower end to avoid meaningless distinctions if scores are below chance alone
How to create the raw-to-scale conversion
Decide on the mean and standard deviation of a group of test takers
Choose two raw scores, specify their scaled scores, then linearly interpolate the other scores
General limitations of equating
A test taker may know more answers on one form of a test
Equating is unable to adjust scores correctly for every test taker!
We strive to be approximately correct for our target population
Two groups could differ based on emphasized material (e.g. a teacher effect)
Equating results in discrete scores (well, we report them that way)
Symmetry of Equating
A score of 20 on test form A corresponds to a score of 25 on test form B
A score of 25 on test form B corresponds to a score of 20 on test form A
This is known as symmetry
Statistical prediction isn't like this!
Cars again
mod1 <- lm(speed ~ dist, cars)
mod2 <- lm(dist ~ speed, cars)
predict(mod1, newdata = list(dist = 100))
       1
24.84066
predict(mod2, newdata = list(speed = 24.84066))
       1
80.10453
Equating Designs
- To make scores comparable you need something similar across the forms
- This could involve ...
- Same group
- Differences in score distributions are a function of form difficulty
- Equivalent groups
- Two random samples from the same population
- Group ability, again, assumed constant and differences in score distributions are a function of form difficulty
- Nonequivalent group
- Two random samples from two populations
- Common anchor items is necessary
- Equating methods more complex
Our first def'n of Equating
“A score on the new form and a score on the reference form are equivalent in a group of test takers if they represent the same relative position in the group.”
Mean Equating
The simplest form of equating involves adjusting the scores by the difference in means between the reference and new forms
Substraction of values if the new form is easier
Addition of values if the new form is harder
Example
Suppose the target population's mean on the reference form was 80 and their mean on the new form was 85.
- Which form was harder?
- What should should someone with a 90 on the new form get on the reference form if we were using mean equating?
Problem with mean equating (Livingston, 2014)

Linear equating
We need to adjust based on how high or low a test taker's score is from the mean
What might we consider doing?
Equating better def'n
“ A score on the new form and a score on the reference form are equivalent in a group of test takers if they are the same number of standard deviations above or below the mean of the group. ”
Linear equating a harder new form (Livingston, 2014)
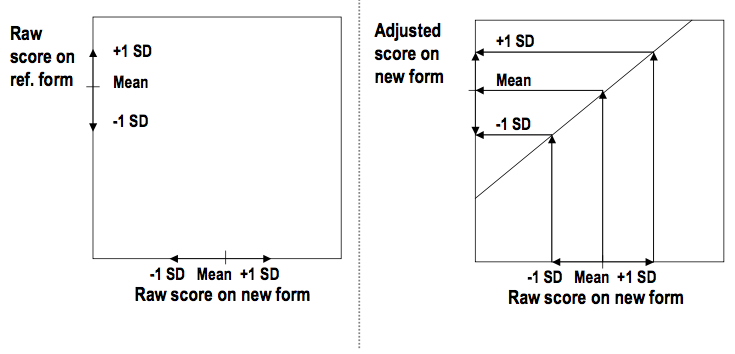
Linear equating conceptually
- Make the adjusted new form mean equal to the reference score mean
- Same with standard deviations above and below the mean
- Do this for every possible value
- This results in a linear relationship between the new form raw and the new form adjusted scores
Doing the maths!
Let NF stand for a score on the new form and RF a score on the reference form
$$ \frac{RF - \bar{RF}}{sd(RF)} = \frac{NF - \bar{NF}}{sd(NF)} $$What do these formulas look like?
Our new adjusted score
$$ RF = \frac{sd(RF)}{sd(NF)}NF + \bar{RF} - \frac{sd(RF)}{sd(NF)}\bar{NF} = \text{adjusted } NF $$Note, the adjusted NF score is very unlikely to ever be a whole number
Example
| Form | Mean | Standard Deviation |
| Reference | 82 | 15 |
| New | 79 | 14 |
If someone scored an 80 on the new form, what should there reference form score be?
# Do the math in R and save it as RF
RF <- (15 / 14) * 80 + 82 - (15 / 14) * 79

# Print RF
RF
[1] 83.07143
Does 83.07413 seem sensible?
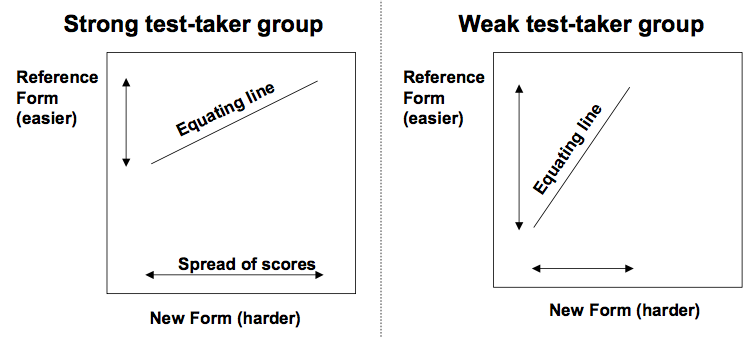
Problems with linear equating
A very high or very low score can equate to a score outside of the range on the reference form
Depends heavily on the group of test takers (e.g. are they strong test takers? weak test takers?)
Equipercentile equating
“To equate scores on the new form to scores on the reference form in a group of test takers, transform each score on the new form to the score on the reference form that has the same percentile rank in that group.”
Equipercentile equating with a harder new form
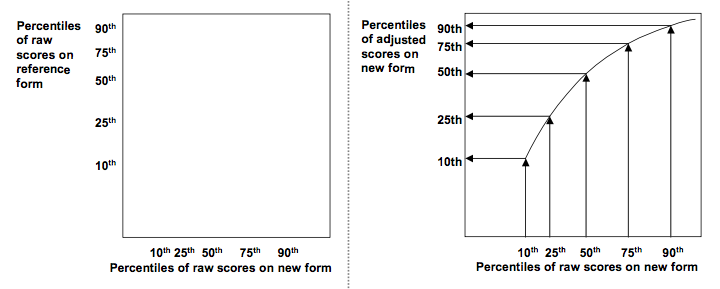
Equipercentile equating
15th percentile of the adjusted test form corresponds (as much as possible) to 15th percentile on the reference form and so on
Adjusted scores will all fall within the range of possible scores on the reference form
The steepness of the slope of the curve can vary
Will result in the adjusted test scores having a similar distribution to the reference form
Will be identical to linear equating when the distribution of scores on the new form has the same shape as the distribution of the scores on the reference form
Smoothing

Limitations of equipercentile
Equating relationship is bound by the highest and lowest observed score
On a difficult test, the highest possible raw score might not be observed
Future administration could result in a higher score being observed
Smoothing may help with this
Again, the discreteness problem (Livingston, 2014)

Can use interpolation to calculate unobserved raw score
Concluding remarks on equating
- Lots of other equating methods exist beyond these three
- Lots of other equating design exist beyond these introduced (briefly)
- Non-equivalent group designs are tricky
- The equate package in R does all of this (and more)