E-411 PRMA
Lecture 12 - Generalizability Theory
Generalizability Theory
Reliability is essentially a measure of consistency in your scores (think of a dart board)
Error doesn't necessarily mean mistake, it can just refer to the measurement procedure/conditions
Generalizability theory, the child of CTT and ANOVA, allows a researcher to quantify and distangle the different sources of error in observed scores
What are we trying to generalize over
The CTT model is: \(X = T + E\)
The G-Theory model is: \(X = \mu_p + E_1 + E_2 + \dots + E_H\)
\(\mu_p\) - universe score and \(E_h\) - are sources of error
G studies
- Suppose we develop a test to measure your writing abilities
- We could have various ...
- Items
- Raters
- These are referred to collectively as facets
- Facets - Conditions of measurement
- If we administered the test on multiple occasions, occasions could also be a facet
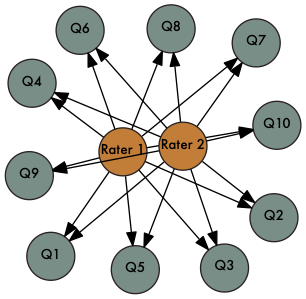
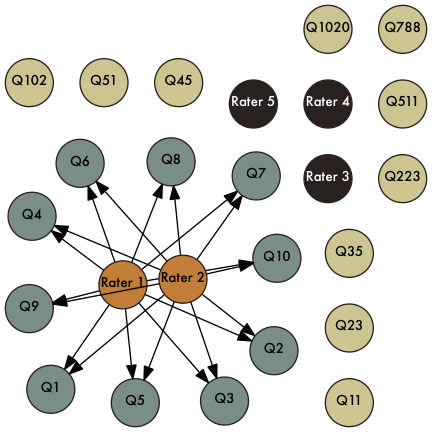
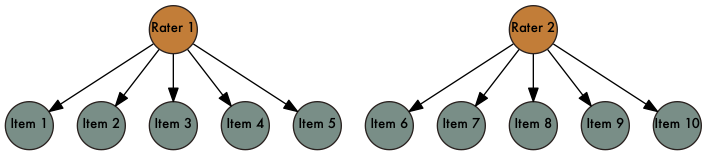
- Let each rater rate each item and assume there are an essentially limitless pool of items and raters could draw from - universe of admissible observations
Fixed Design
Random Design
Nested Design
More terminology
- universe - conditions of the measurement
- population - objects of measurement
- This is our typical notion of a population
- G-study - Set up study design and estimate the variances
- Universe of generalizations - What are we trying to generalize to? Just these items and raters? Or are these items and raters a sample from all items and raters?
Our model
Recall, each rater rates each item
\(X_{pir} = \mu + v_p + v_i + v_r + v_{pi} + v_{pr} + v_{ir} + v_{pir}\)
If we assume that that these effects are uncorrelated then
\(\sigma^2(X_{pir}) = \sigma^2_p + \sigma^2_i + \sigma^2_r + \sigma^2_{pi} + \sigma^2_{pr} + \sigma^2_{ir} + \sigma^2_{pir}\)
These are our variance components
In a G study, we estimate each of these variance components
They can be estimated using aov() or lme4::lmer() functions in R
This forms the basis of our D study, which is used to investigate different scenarios and allow us to calculate different reliability estimates based on our use
D study
- We need to decide if our facets should be considered fixed or random
- We need to know if they are nested within one another
- This will determine our universe of generalization and has implications for our reliability estimates!
What does the D study give us?
- It tells us what effect changing the number of ...
- Items
- Raters
- Testing Occasions
- Whatever
- ... affects reliability
Consider Raters and Items crossed (p x R x I design)
We need to derive universe score, relative error, and absolute error variances
\(\sigma^2(X_{pir}) = \sigma^2_p + \sigma^2_i + \sigma^2_r + \sigma^2_{pi} + \sigma^2_{pr} + \sigma^2_{ir} + \sigma^2_{pir}\)
The variances based on our design
universe-score variance $$\sigma_{\tau}^2 = \sigma_p^2$$
relative error variance$$\sigma_{\delta}^2 = \frac{\sigma_{pi}^2}{n_i^`} + \frac{\sigma_{pr}^2}{n_r^`} + \frac{\sigma_{pir}^2}{n_i^`n_r^`} $$
absolute error variance$$\sigma_{\Delta}^2 = \frac{\sigma_{i}^2}{n_i^`} + \frac{\sigma_{r}^2}{n_r^`} + \frac{\sigma_{ir}^2}{n_i^`n_r^`} + \frac{\sigma_{pr}^2}{n_r^`} + \frac{\sigma_{pi}^2}{n_i^`} + \frac{\sigma_{pir}^2}{n_i^`n_r^`} $$
IMPORTANT: What we consider fixed or random determines what goes where!
D study estimates
Now that we've partititioned our variance into 3 components: universe score, relative error, and absolute error variance.
Relative error and the generalizability coefficient, are analagous to \(\sigma^2_E\) and reliability in CTT, and is based on comparing examinees
\(E\rho^2 = \frac{\sigma^2_\tau}{\sigma^2_\tau + \sigma^2_\delta}\)
Absolute error variance is for making absolute decisions about examinees
Dependability coefficient, \(\phi = \frac{\sigma^2_\tau}{\sigma^2_\tau + \sigma^2_\Delta}\)
Icelandic writing test
Again, consider our G-study in which Icelanders answer items on a writing test that were scored by multiple raters.
| Source | Variance component | Estimate | Total variability (%) |
| Person (p) | $$\sigma_p^2$$ | 1.376 | 32 |
| Item (i) | $$\sigma_i^2$$ | 0.215 | 05 |
| Rater (r) | $$\sigma_r^2$$ | 0.043 | 01 |
| p × i | $$\sigma_{pi}^2$$ | 0.860 | 20 |
| p × r | $$\sigma_{pr}^2$$ | 0.258 | 06 |
| i × r | $$\sigma_{ir}^2$$ | 0.001 | 00 |
| p × r × i | $$\sigma_{pir}^2$$ | 1.548 | 36 |
What do those numbers actually mean?
- The large person variation (32%) means there was a lot of between person variability even after accounting for items and raters
- This is our universe score variance in our example
- 5% of the variation was associated with items (i.e. items were of varied difficulty)
- Only 1% of the variation was associated with raters
- 20% of the variation for p x i - means that person relative standings differed by items
- 6% of the variation for p x r - means that person relative standing differed somewhat by raters
- 0% of the variation for i x r - means the ordering of the item's difficulty did not change by raters
- 36% of the variation for p x i x r - means relative standing varied by item and rater and other sources of error not controlled for in the study
Do you think changing the numbers of items or the number of occasions would have the biggest affect on reliability?
D-study 1 - 20 items and 3 raters
$$\sigma_{\delta}^2 = \frac{\sigma_{pi}^2}{n_i^`} + \frac{\sigma_{pr}^2}{n_r^`} + \frac{\sigma_{pir}^2}{n_i^`n_r^`} = \frac{0.86}{20} + \frac{0.258}{3} + \frac{1.548}{3*20} = 0.1548$$
$$\sigma_{\Delta}^2 = \frac{\sigma_{i}^2}{n_i^`} + \frac{\sigma_{r}^2}{n_r^`} + \frac{\sigma_{ir}^2}{n_i^`n_r^`} + \frac{\sigma_{pi}^2}{n_i^`} + \frac{\sigma_{pr}^2}{n_r^`} + \frac{\sigma_{pir}^2}{n_i^`n_r^`} = \frac{0.215}{20} + \frac{0.043}{3} + \frac{.001}{3*20} + \frac{0.86}{20} + \frac{0.258}{3} + \frac{1.548}{3*20} = 0.1799$$
\(E\rho^2 = \frac{\sigma^2_\tau}{\sigma^2_\tau + \sigma^2_\delta} = \frac{1.376}{1.376 + 0.1548} = 0.899\)
\(\phi = \frac{\sigma^2_\tau}{\sigma^2_\tau + \sigma^2_\Delta} = \frac{1.376}{1.376 + 0.1799} = 0.884\)
What if we used just 10 items and 2 raters?
\(E\rho^2 = 0.824\) and \(\phi = 0.803\)
So reliabilities decrease!
Comparing G-Theory to CTT
- CTT reliability estimates are often incorrect
- When we have more than 1 random facet, CTT reliabilities are too high
- Different D-study scenarios allow you to investigate what-ifs based on number of items, raters, occasions, test forms, etc
- Some take homes from CTT
- Universe score variance gets smaller if we consider a facet fixed instead of random bc we reduce our universe of generalization!
- Larger D study sample sizes lead to smaller error variances
- Nested D study designs usually lead to small error variances and larger reliability coefficients